In my last post, I described how I built my lovely (and massively overpowered) network UPS system. But it was missing something: a way to monitor the charge of the UPS. In principle, you’d use this information to tell equipment when it needs to gracefully shutdown.
In practise, I’ve tried to avoid ever needing to shut down equipment by sizing it such that it can cope with any likely outages, but given that it doesn’t actually make any noise when the power fails, it is important to be able to easily see what’s happening internally.
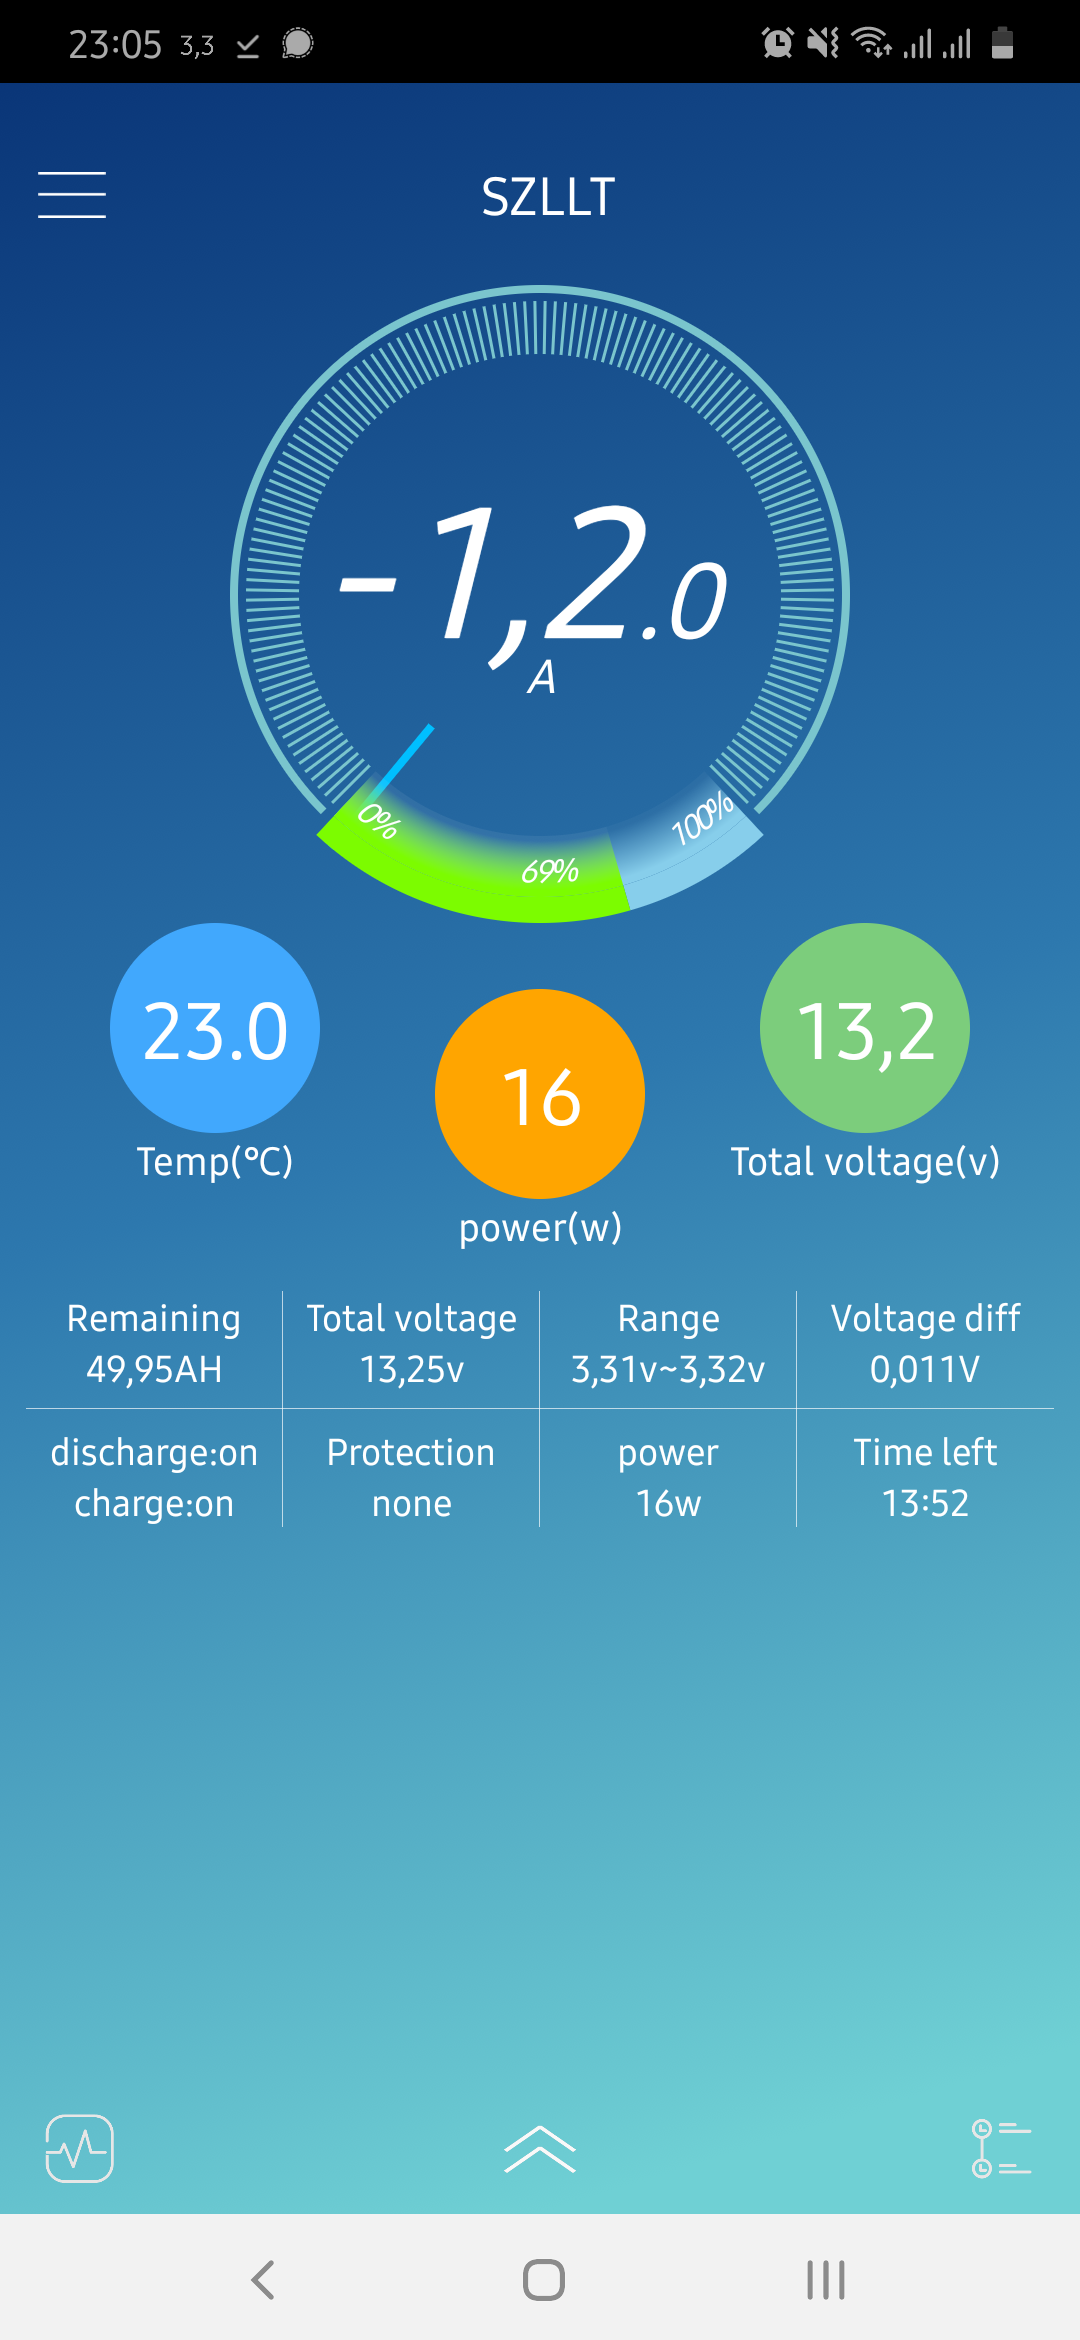
The first answer to this is built into the Battery Management System that controls the UPS: you can download an app that connects to the Bluetooth dongle on the BMS, which gives you the information you need.
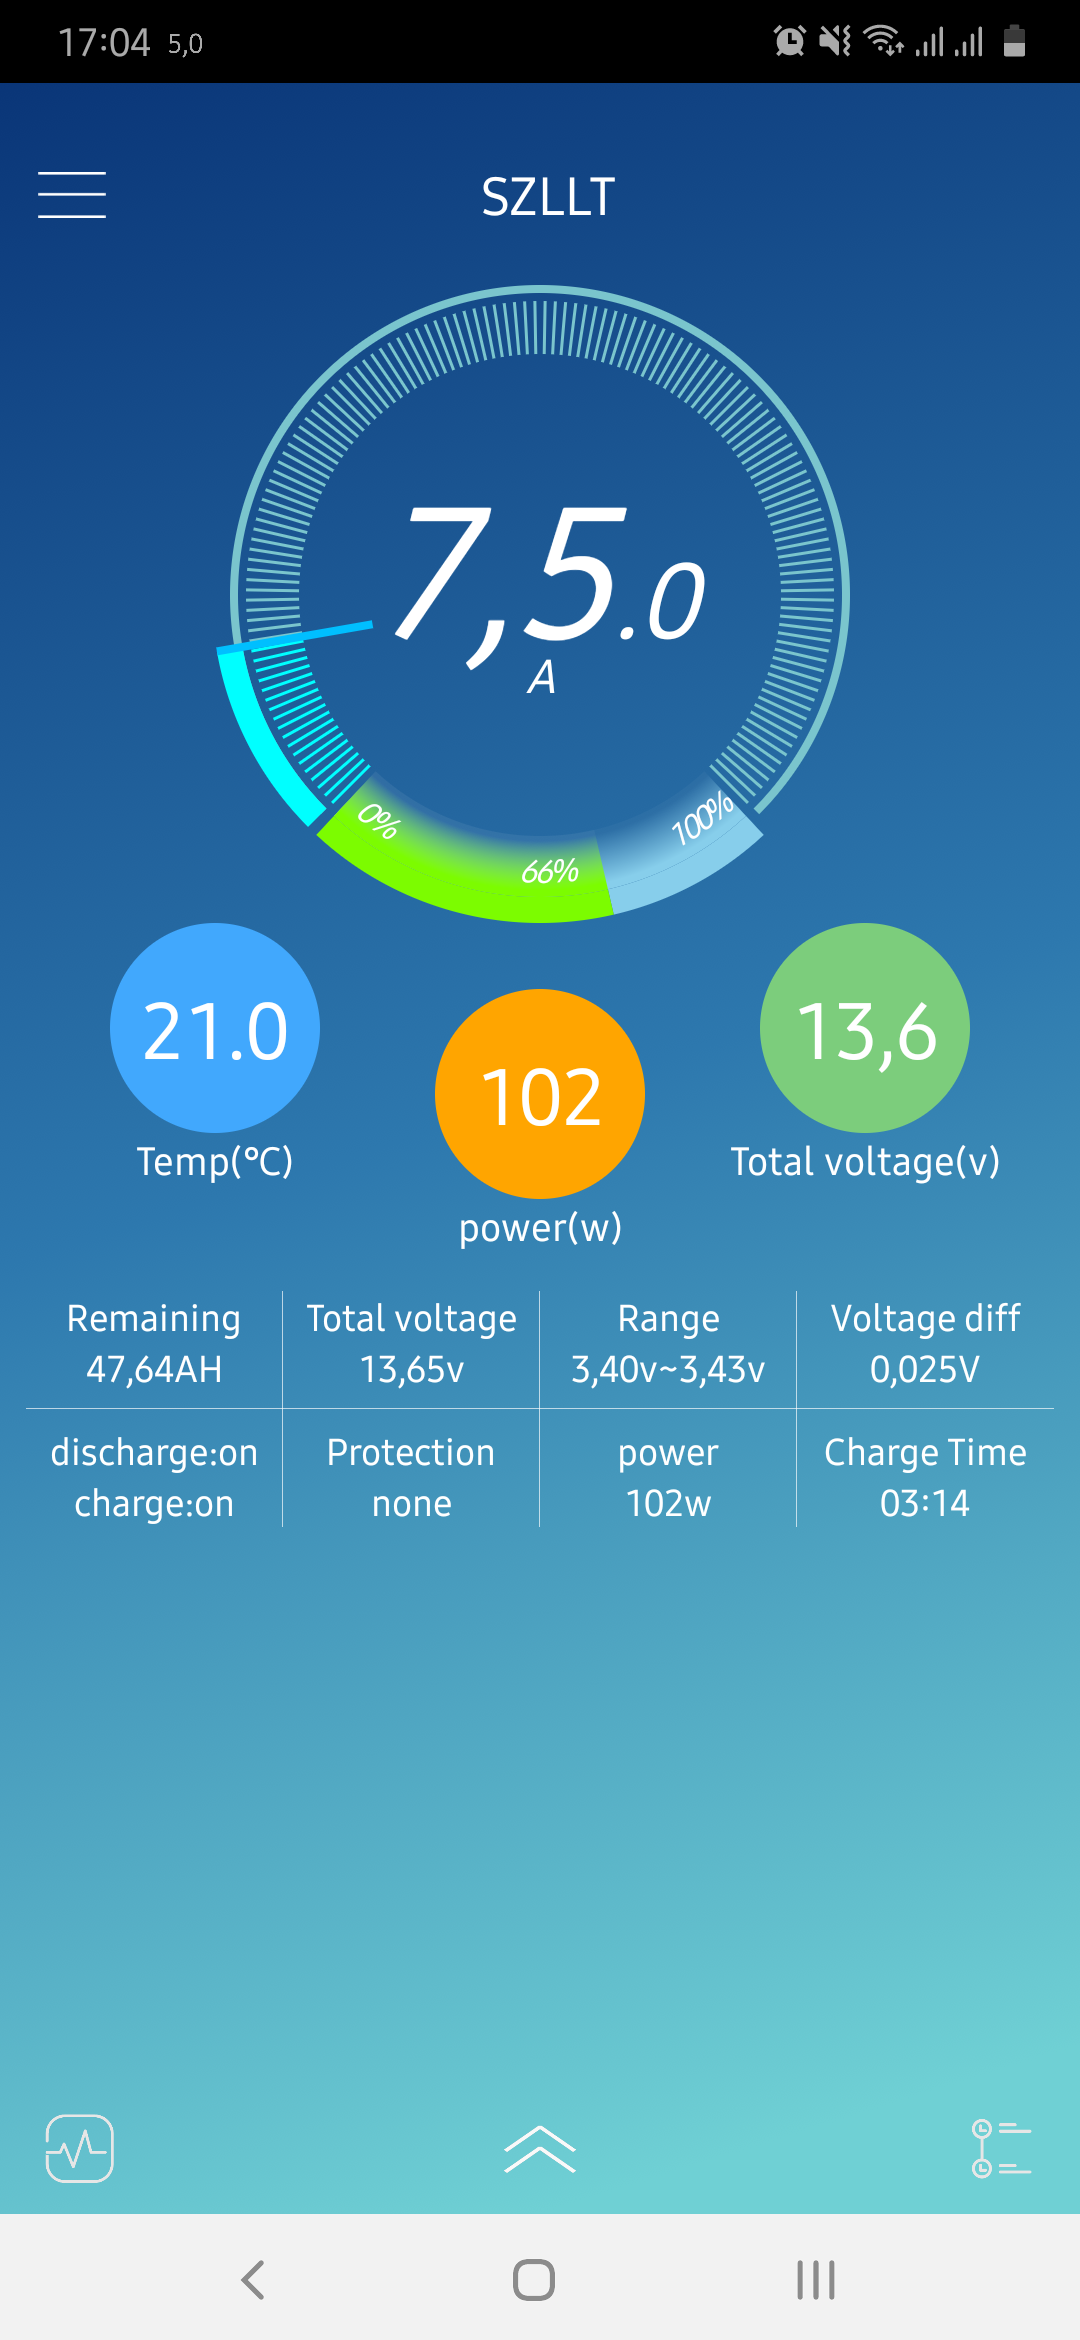
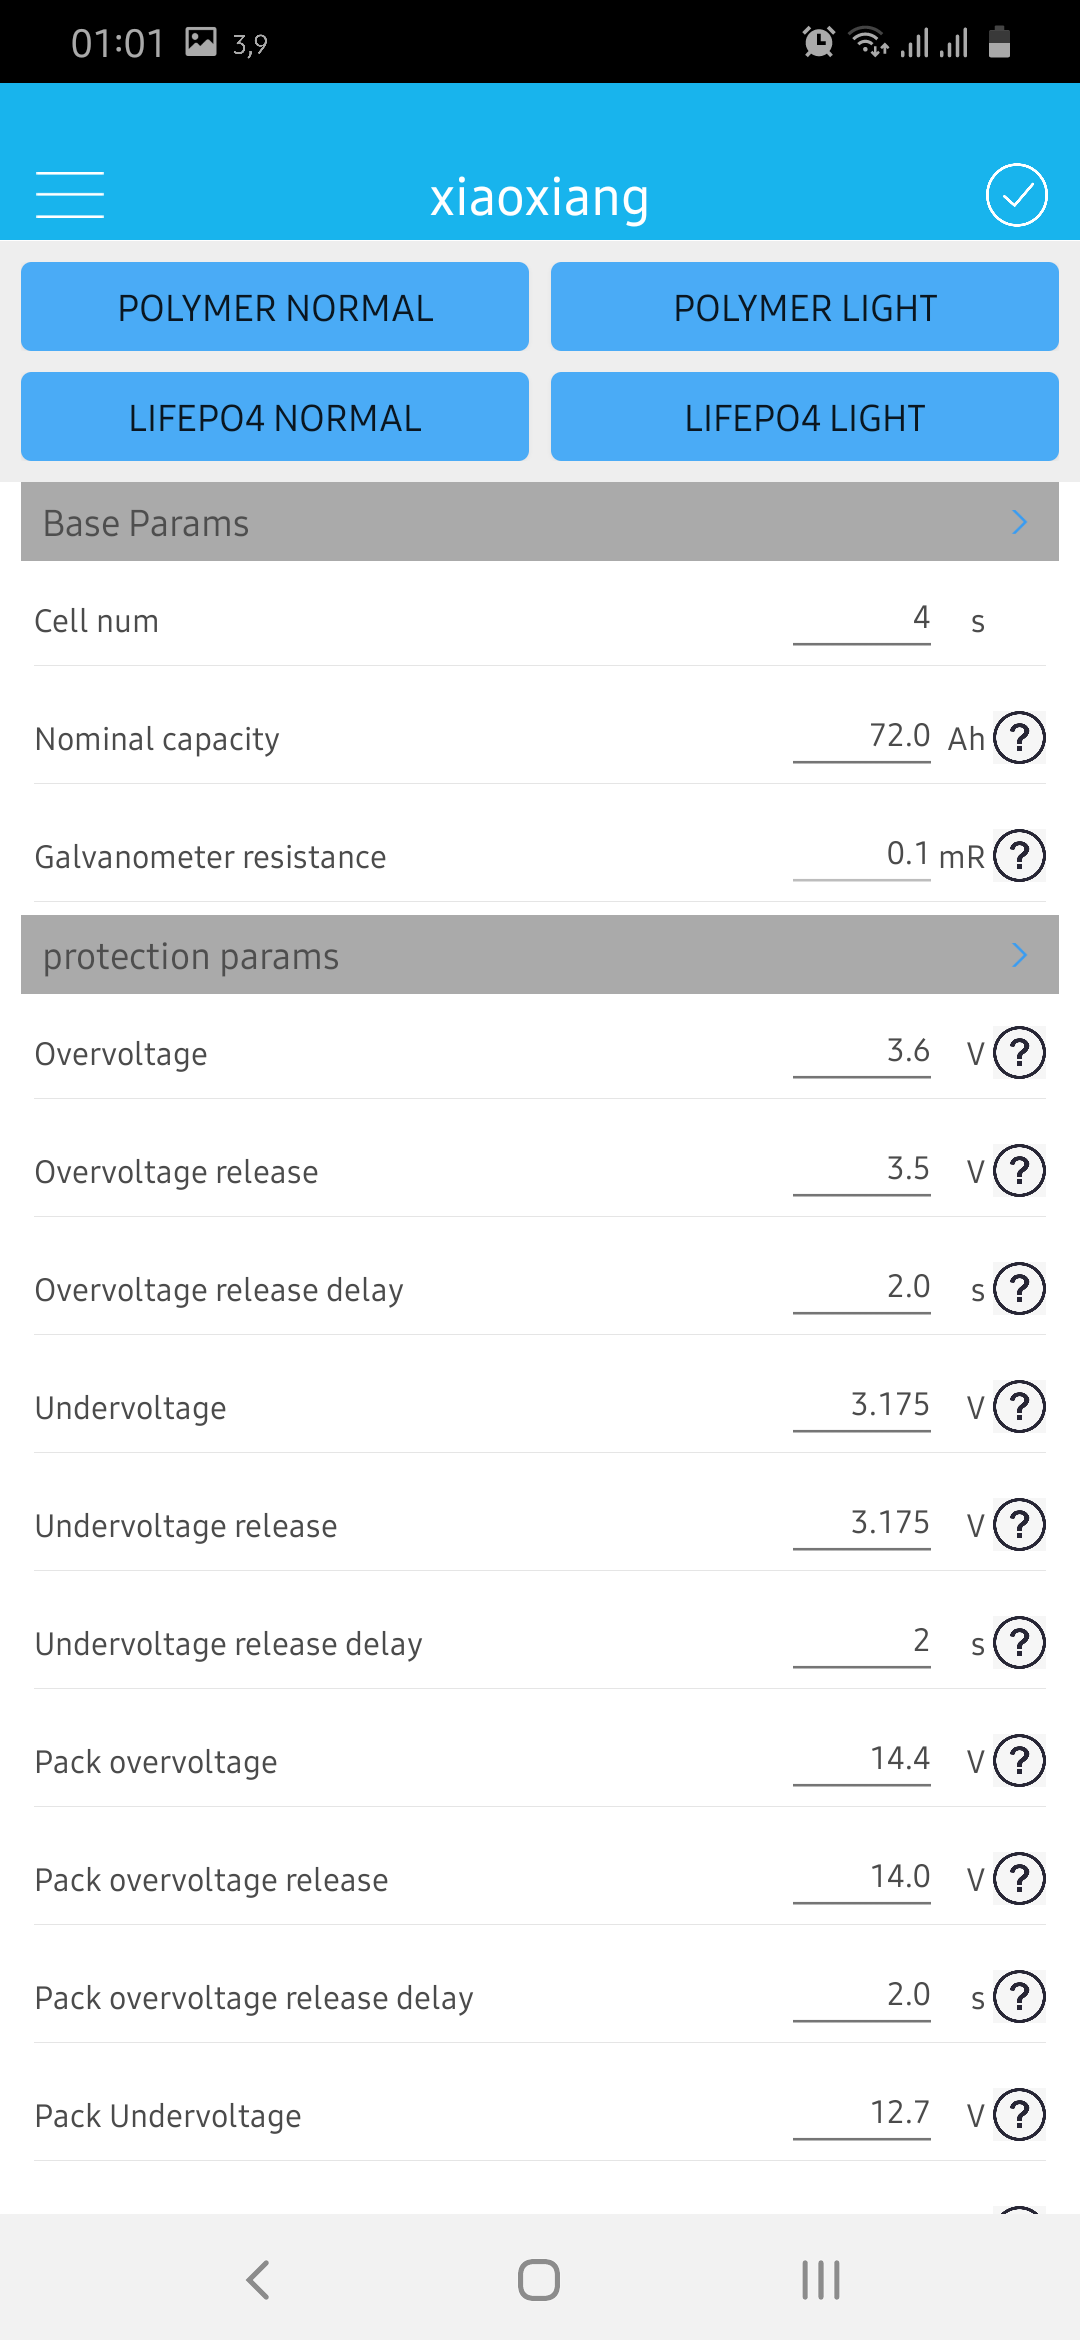
The ability to programme the BMS is invaluable, but it would be nice to have historical data! Well, it turns out that if you dig around, you can find a spreadsheet that describes the basic API for reading data from the BMS.
My efforts to read the data have resulted in a Python script, bms.py, which you can grab off my git repository.
Initially, it just provided text-based information, but I’ve wanted to fiddle with Prometheus and Grafana for a while. It didn’t take long (including some data structure restructuring) to use Prometheus’s Python client bindings to add a continuous data exporter (technically, it only updates every 30 seconds, which seems sufficient to me).
Importing this data in Grafana yields these lovely graphs:
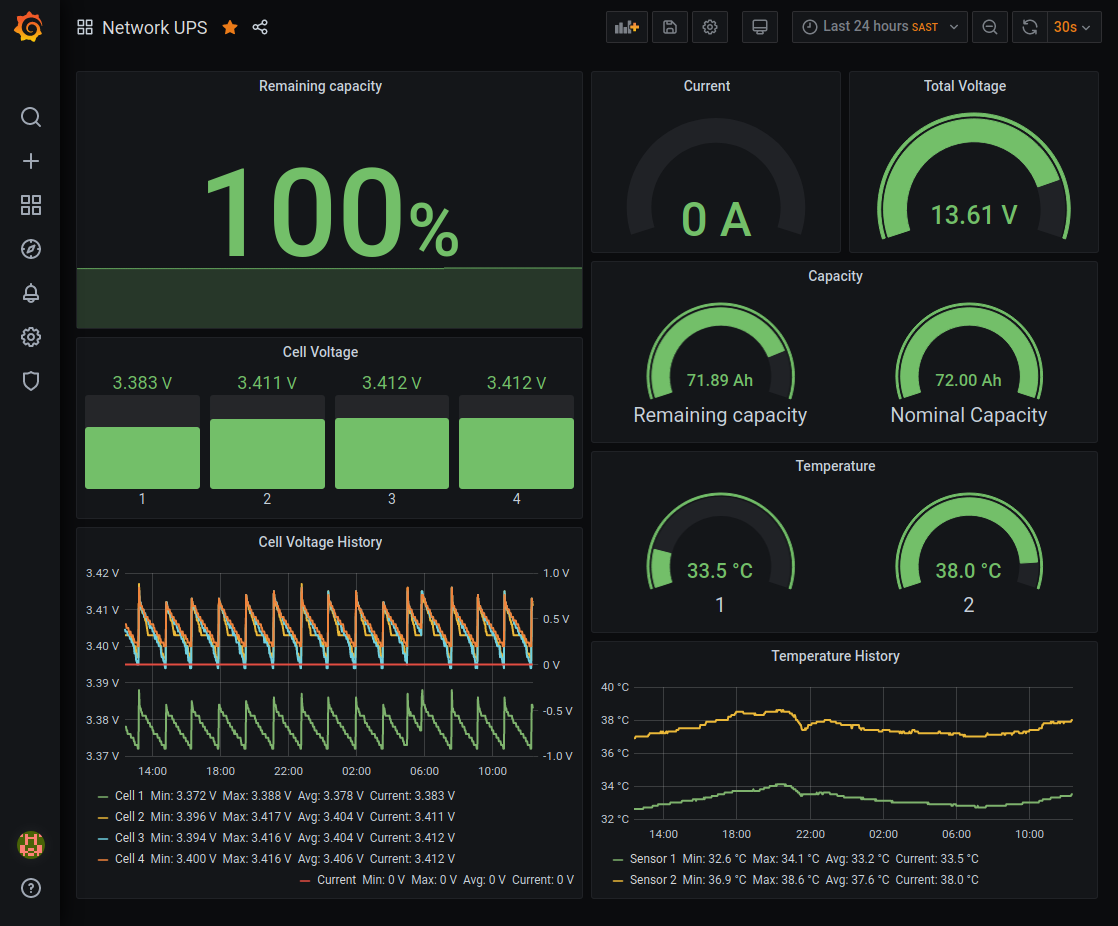
I haven’t yet taken any screenshots during a power cut, because I turn my computer off, but this is what it looks like afterwards:
.png)
Note the tiny bump under the 100% indicator: the BMS thinks it has lost 8% capacity in the 2 hours of the power cut. Let’s take a closer look:
.png)
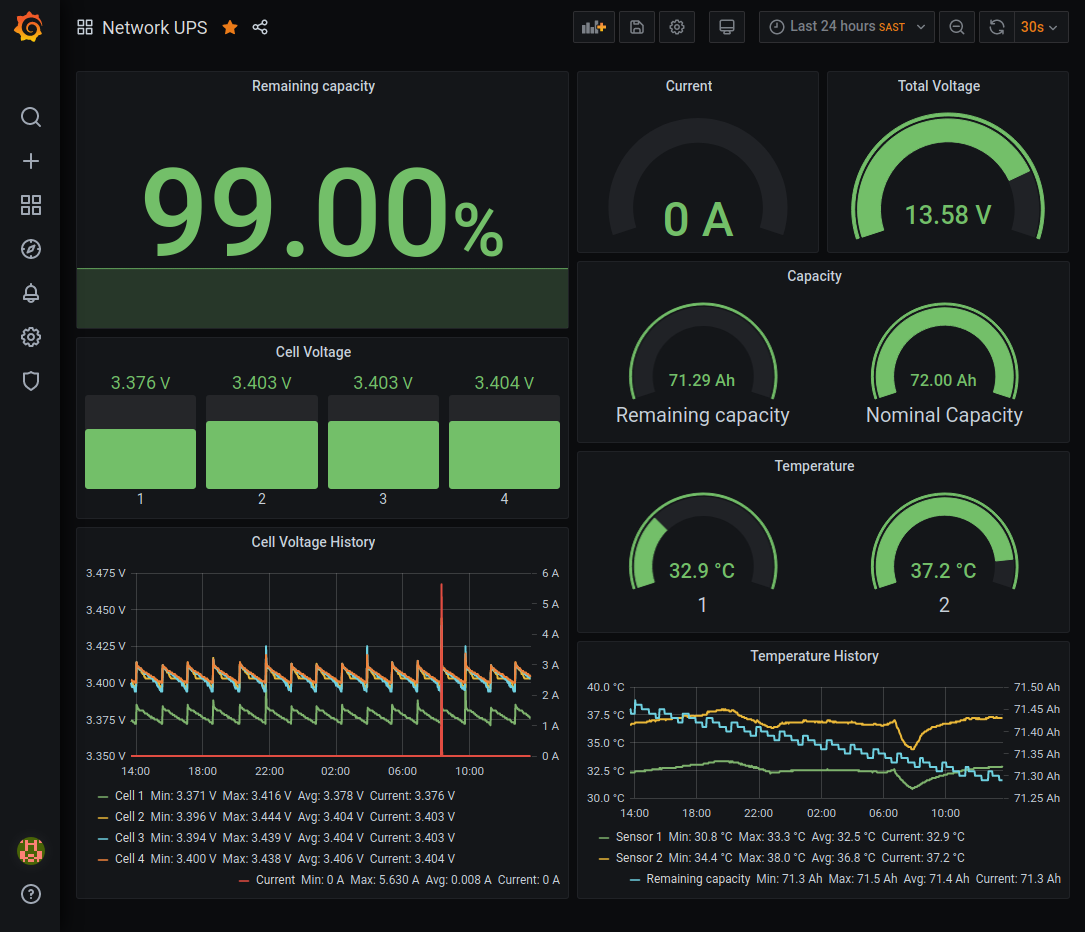
Of course, this only tells us what the BMS thinks about its own capacity (as a percentage; there is an amp-hour value in the temperature history graph, but it’s probably even less accurate); this is pretty unreliable. Diving into a detailed collection of more specific data highlights two important bits:
- The rate of discharge: a fairly consistent 2.3A over the two hours of the power cut.
- The length of time to recharge: 1 hour, at a rate that starts at 5A and drops to 4A.
.png)
This suggests that the UPS is able to charge twice as fast as it currently discharges. I was expecting the charge process to take several hours, so this is a significant win. Typically, the slow charge is to designed reduce waste heat (although I don’t have a specific source for this claim!), so it’s good to see that the extra fan built into AC/DC adapter actually drops the temperature.
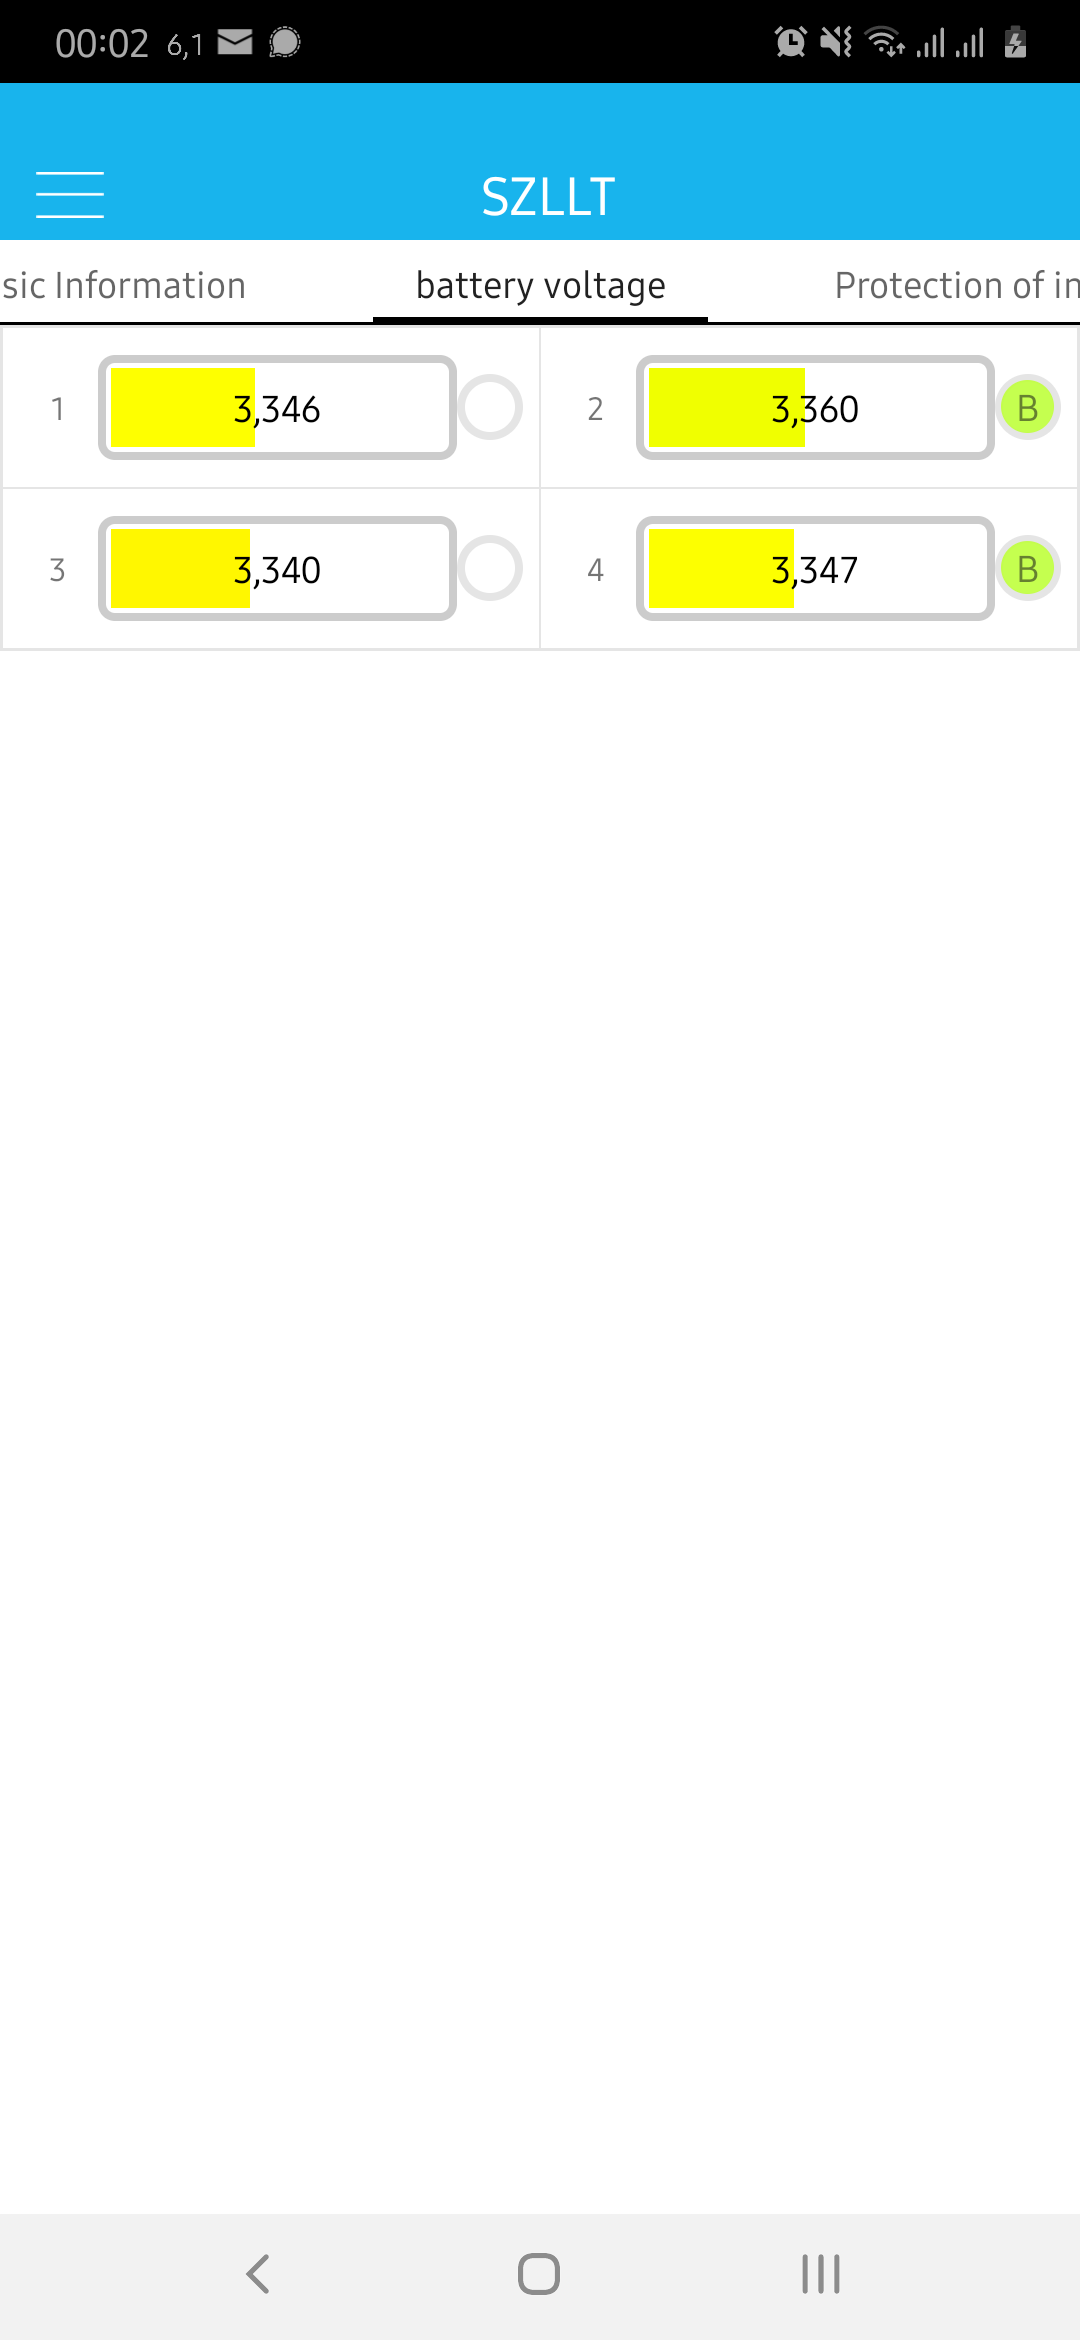
The other thing to note is the discharge profile of the cell groups: a rapid fall from 3.4V to 3.3V, and then a slow drop to 3.275V. I have set the cutoff to 3.2V, so despite my claim of a 20 hour run-time, it may be that we can only squeeze another hour out! It might be worth reducing the low-voltage cutoff to improve the run-time, but I’ll need to do some testing first; LiFePO4 cells are known for having very flat discharge voltage profiles.
A last note is that, having worked with Prometheus a bit, I’m finding that I am really using the historical data; this isn’t a particular strength of Prometheus. I am planning to switch to InfluxDB in the near future (probably when their 2.0 Docker image gets a little more stable).